A/B testing involves displaying two different variations of your content to your online visitors. This means that for example 50 % of visitors are shown variation A (The control) and the other 50% are shown variation B (The variation). The performance of both versions is measured, then evaluated and used to optimise your final content. The aim is to determine, which variation performs better for the given conversion goal.
Get to know A/B testing in a nutshell by watching the video below, or continue reading for step-by-step instructions.
Instructions
This article helps you create your first test. We will walk you through:
Planning your test
Creating your test
Monitoring and analyzing the test
Ending your test
Plan your test
- What is your goal?
Common examples would be getting more sales, more leads, more bookings, or more visitors to a certain page. When you have figured out what you are after, configure goal tracking in giosg in Settings → Goals. Read more about creating goals here. - How do you plan to reach the goal?
These will be the actions you are testing with your test. Often, these actions are small and incremental - trying a new chat button text, a different visualisation for a banner, or a new flow for a chatbot. - Who do you want to reach with your test?
Which of your visitors should the test be targeted to? For example, you can target the test only to visitors from a certain country, or only to visitors who have put something in their shopping basket.
In general, A/B tests are often done by testing one specific variable at a time. Testing one element, such as an image or copy text can make it easier to draw conclusions.
Create the A/B test
Before you start creating your test, make sure you have created the goal (what do you want to improve with the test) in Settings → Goals. If you are comparing different interactions in the test, also make sure you're interactions are ready and published.
Once the goal has been set, head over to Reporting → A/B tests and click "+ Create A/B test"
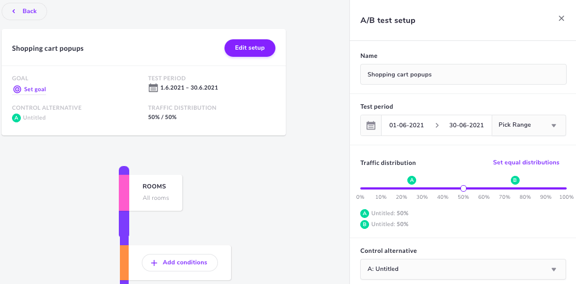
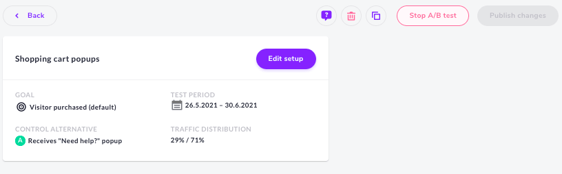
- Click "Edit setup". Name your test, add the planned testing period (can be extended when the test is live), and adjust the traffic distribution if needed. You can also already define your control group.
- Define the condition(s) for the test from " + Add conditions" .
With the conditions you are able to target the visitors that the test is for. Visitors that enter your page are assigned to testing groups (alternatives) and the test will run for visitors that meet the defined conditions.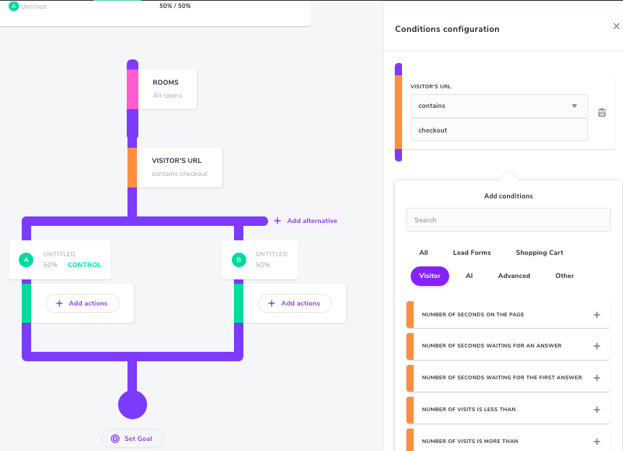
- Set the actions for your alternatives (groups) - what do you want to show for each group?
You can add more alternatives if needed. Naming the groups makes analyzing the test a lot easier.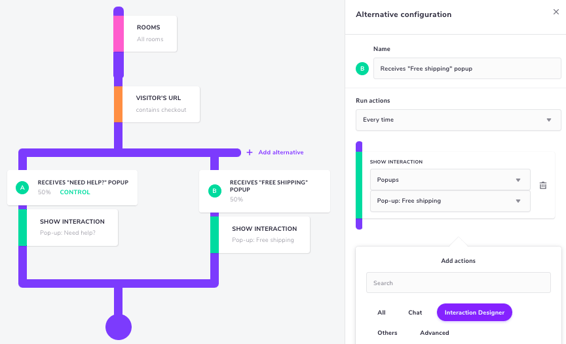
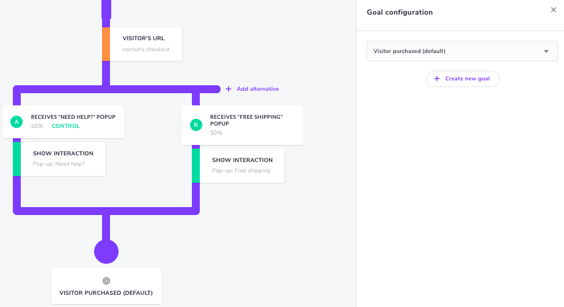
If you are testing interactions created with giosg Interaction Builder, only published interactions are available for A/B tests. Create and publish the interactions in Interaction builder and then create the test. - Set a goal for your test by clicking "Set goal", and choose the goal you created in Settings → Goals. If you have not created your goal yet, don't worry! Just save the test as a draft (from the top right of the page), create your goal and then finalize the test.
- Start your test by clicking "Publish A/B test" at the top right of the page.
After publishing the test you can still edit the test period and adjust the traffic distribution for the alternatives.
Monitor and analyze your test
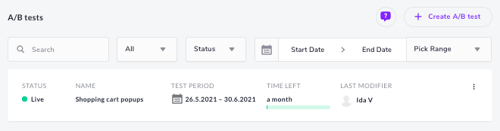
The Reporting → A/B tests page gives you an overview of all your tests, and you can easily see which ones are live. Click on a test to see how it is performing.
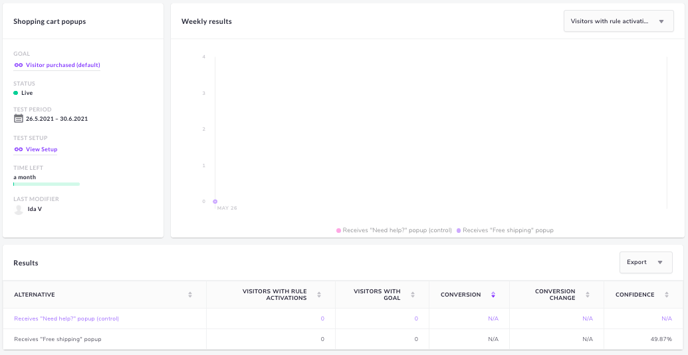
The A/B test report lets you compare the alternatives over time and tells you which group is converting better. The report gives you the numbers for:
- Visitors with rule activations: the number of visitors that got exposed to the action(s) defined for the group.
- Visitors with goal: the number visitors in the group that met the goal set for the test.
- Conversion: the amount of visitors with rule activations that reached the goal
- Conversion change: the difference in conversion between the control group and the variation.
- Confidence: the validity of your test. Anything over 95 % confidence is usually considered statistically significant.
Ending your test
You can always adjust the time period for the test when the test is live. This can be done from Reporting → A/B tests → Open a test → View setup.
If you need to end a test, simply click "Stop A/B test" on the setup page or edit the test period end date.
Although technically possible, we usually advise against stopping the A/B test before you have planned to, to avoid stepping into the pit of false discovery. If you stop the test as soon as you see results you like, it might lead to wrong conclusions as we do not know if the effects were temporary.
Please visit our A/B test Q&A article for more details on how giosg A/B tests work.